Introduction
When it comes to analyzing a company, one of the most commonly used methods is using comparable company analysis. This method helps in comparing a company with a benchmark and this helps in identifying the areas where the company is doing well and those where there is room for improvement. But, many times, people find it difficult to calculate the comparable company analysis. But, no worries to be taken. You have landed in the right place. This article will discuss the comparable company valuation analysis steps with an example. The various comparable company analysis pros and cons are also given below. Besides that, you will also learn how to do Comps analysis in excel.
Let’s check it out.
What Is Comparable Company Analysis?
Comparable company analysis is one of the methods of relative valuation. In Comps, you try to find the value of a company by comparing other companies in the same industry. E.g., if you want to see the value of Apple Inc, you will compare ratios of companies like Samsung, Dell, Google, etc. In the later section of the article, we discussed comparable company analysis steps and the comparable company analysis valuation example.

Comps also help the company to find whether the company is overvalued or undervalued. Likewise, if the industry has an average EV/EBITDA multiple of 20x, and yours is 15x. It implies the companies in that industry should also have an EV multiple of 20x.
Elements / Data Needed For Comps
Now that you know about Comps let’s understand the elements needed in the comparable company analysis steps. There are certain elements you need to find before performing Comps analysis. Let’s check it out.
- Peer universe: Peer universe means finding similar companies or your competitors in the industry. You have to select specific companies in the same industry you are working in. For example, if you want to find the value of an IT company, find similar companies in the same industry.
- Multiples/ Ratios: The next main element of Comps is selecting specific ratios and multiples that will help you find the mean(average) of the industry. For example, Price to Sales Ratio, EV/EBITDA, EV/EBIT, Price to Earnings, etc.
- Enterprise value or EV: The main element is finding the value of Enterprise value. Besides that, enterprise value can also be used to calculate the multiples.
- Financial results: Financial statements play an essential role in the Comps. You can easily find these results in the annual reports of the company. Make sure to take the “Last 12 months data(LTM)“. For stock prices and market cap information, you can visit MSN or Google Finance.
How To Do A Comparable Company Analysis?
Now that you know briefly about Comps let’s look at comparable company analysis steps. There are 4 easy steps to perform the Comps analysis. Below is a comparable company valuation analysis example, do have a look. Before that, let’s understand the steps of comparable company analysis.
- Step 1 (Select the company): The first and the foremost step includes collecting data of the company for whom you want to do Comps analysis. You can choose any company of your choice. But, make sure that the company has all the data available. You can get all the data at either Bloomberg, annual reports, Google finance, etc.
- Step 2 (Find companies in the same sector): The next step is to “Find similar companies or companies in the same sector.” The closer the match, the better. This is done because you can compare the data and analyze the data effectively if you select similar companies. Next, list down the prices, market cap, sales, and revenues of all the companies.
- Step 3 (Calculate the ratios and Multiples): Now that you have selected the companies, “Calculate the Ratios and Multiples of the companies.” These ratios include EV/EBITDA, P/B ratio, P/S, etc.
- Step 4 (Calculate the median and average): Lastly, “Calculate the Average and Median of the multiples” you have calculated. E.g., if the average EV/EBITDA is 12.5x, the analyst needs to multiply the earnings by 12.5 times to arrive at their equity value.
Comparable Company Analysis Valuation Example
1. Selecting Companies And Finding Data
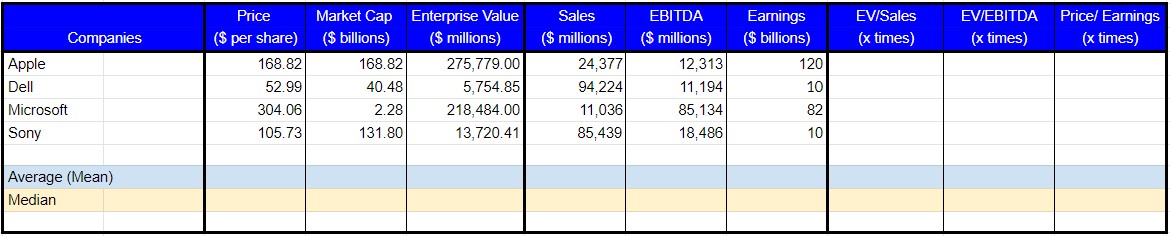
The first step is to select a particular company and find companies in the same sector. Here, we have selected Lenovo as the main company and taken similar companies in the IT sector. For example, Apple, Dell, Microsoft, Sony. Likewise, you can also take companies in the automobile sector like Toyota, Volkswagen, Ford, etc. But, see to it, you take those companies listed on the exchange, companies that keep on releasing their annual/quarterly results every year.
Likewise, fill in the data regarding stock price, Market cap, EBITDA, Sales, etc. But, you will need to calculate Enterprise value. The formula for enterprise value is;
Enterprise Value = Market cap + Preferred stock + Outstanding debt + Minority interest – Cash & cash equivalents
2. Calculating Ratios And Multiples
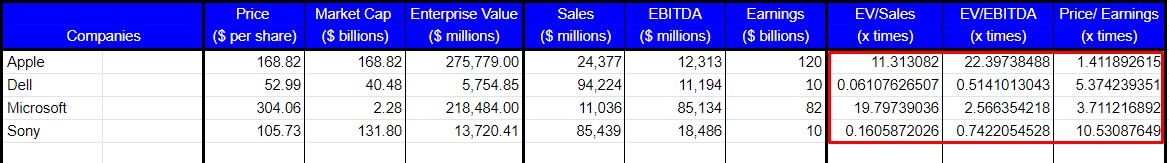
The next step in comparable company analysis is to calculate Ratios and Multiples for the following companies. You can choose any ratios or multiples. For example, we have chosen EV/EBITDA, EV/Sales, and P/E ratio here. For EV/EBITDA, you need to divide Enterprise value by the EBITDA of the company. As you can see, the EV/EBITDA value of Apple company is 11.31x. Similarly, you can calculate for the other companies.
3. Find The Mean And Median
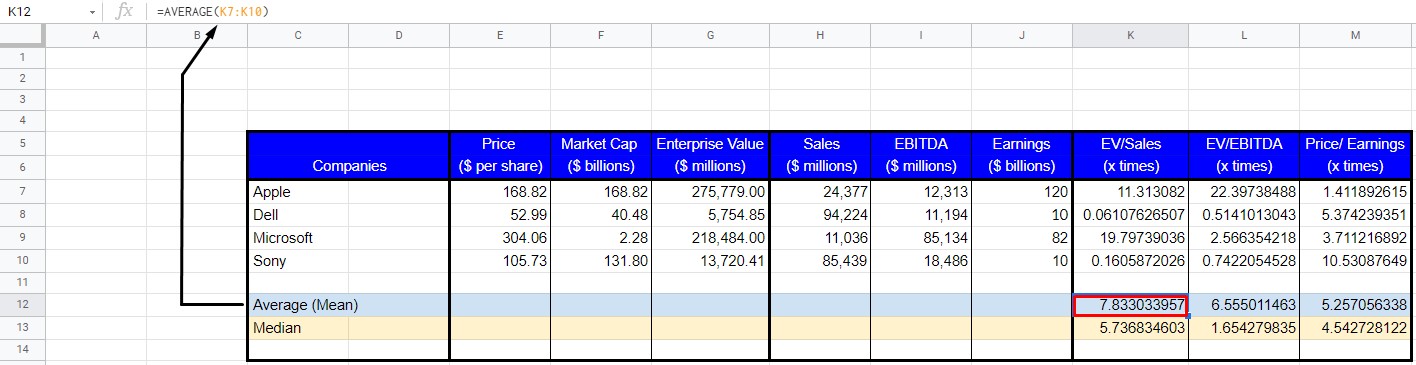
The last step is to find the Mean and Median of the multiples and ratios calculated. Once you have calculated the multiples, take the mean and median of each multiple. Just type the function in excel,
=Average(number of cells).
For Median type,
=Median(number of cells).
In place of the number of cells, drag the cells for whom you want to take the mean. In the above example of comparable company analysis, the Average Mean of EV/Sales is 7.8 times. It means if you want to know the value of Lenovo, you have to multiply its Sales by 7.8.
7.8 = EV/ Sales 6.5 = EV/EBITDA
7.8 x 60,742 = EV or 6.5 x 29,990 = EV
EV = $4,73,788 million EV = $1,94,935 million
This implies that Lenovo’s worth is between $1,94,935 to $4,73,788 million.
Comparable Company Analysis: Pros And Cons
If you wish to find the company’s value by Comparable company analysis, you need to consider its various Pros and cons. Here, we have given the difference between Comparable company analysis pros and cons. Let’s have a look over it.
Pros | Cons |
Easy to calculate because the data is easily available. | Since the market keeps on changing, the values might prove to be wrong in the long run. |
Besides that, it is easy to communicate across various market participants. | Not useful when there are very few companies. |
Sets a benchmark or aims for multiples in the valuation. | It can be slightly difficult to find the right companies for comparison. |
Application Of Comparable Company Analysis
The main question is that if we are calculating Comps, where can it be used? Well, there are various uses of comparable company analysis. Many analysts and investors use comparable company analysis models, private companies also. Let’s have a look over it.
- Initial Public Offerings (IPO)
- Follow-on offerings (issues additional shares to raise funding)
- Mergers And Acquisitions (Combining or acquiring other companies)
- Fairness opinions (detailed valuation of a company that is to be sold)
- Share buybacks (pulling back all your shares from the market)
- Terminal Value in DCF model
Conclusion
Companies need to perform a Comparable Company Analysis because it provides a detailed look at the relative performance of different companies. As Comps is a part of the relative valuation method, analysts find it easy to find the company’s value. We have given comparable company analysis steps to make your work easy that will help you understand the Comps analysis even better. Besides that, we also performed an example in Excel so that you can understand it in a much better way. Also, the comparable company analysis pros and cons are given below. We hope this article was helpful to you. If you have any doubts, you can freely ask in the comment section below.
FAQs
Comparable Transaction analysis is basically used during mergers and acquisitions. When one company wants to acquire another company, it usually performs Comparable transaction analysis. Whereas, Comps analysis tries to compare companies in the same sector. Although the goal of both the methods is to find a relative value of the company, the process is different.